
Graphics
97.00/ 100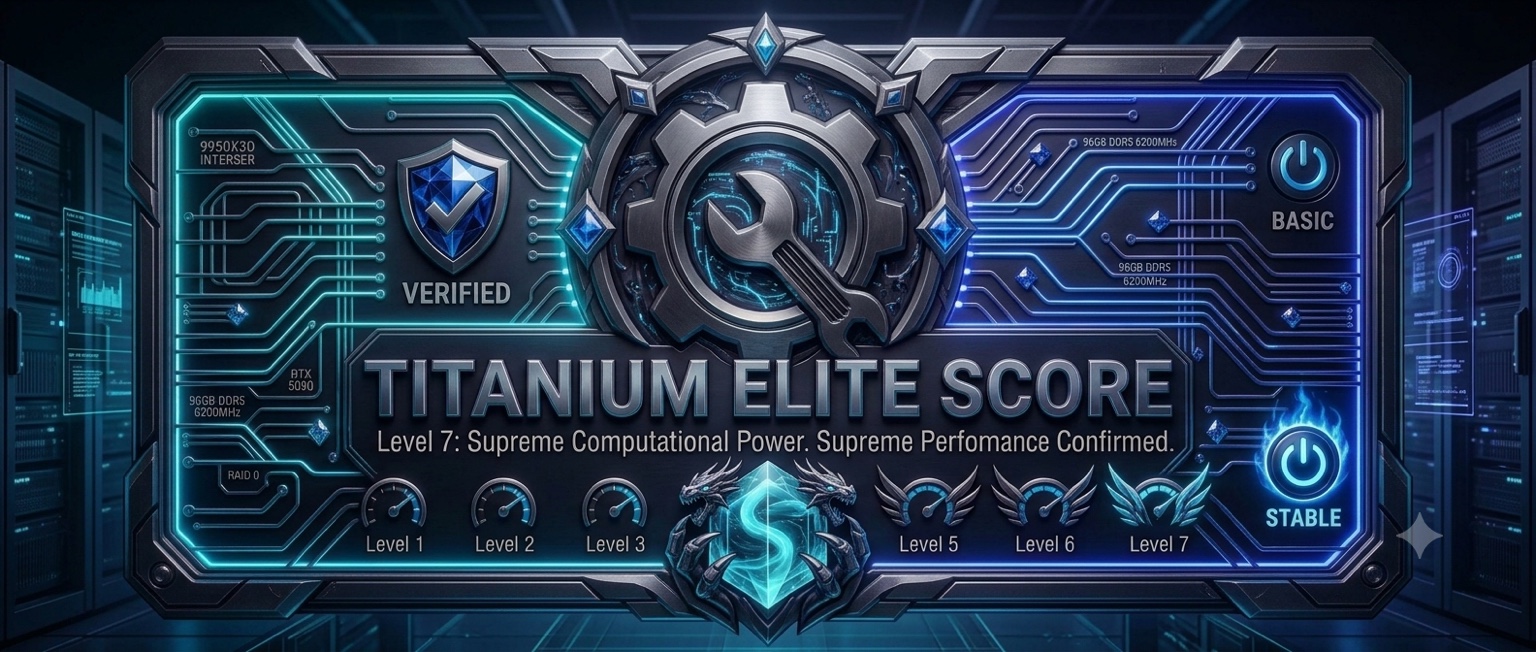 Titanium Elite
Sep 29, 2026 · 00:27 UTC · Benchmark Standard · Completed benchmark
AI Now Bench 7 tier score
Tier artwork reflects the reported score. Received & stored confirms receipt of the run; it is not independent hardware certification.
Titanium Elite TitanTitanium EliteTitanTitanium EliteTitan
| Test | Measurement | Status | Score | Tier |
|---|---|---|---|---|
| GPU Spectrum 8K Maximum Performance FPS | 42.302387241440371 FPS | PASS | 96.95 | Titan |
| GPU Spectrum 4K Balanced Performance FPS | 166.96045207771635 FPS | PASS | 96.90 | Titan |
| GPU Spectrum 1080p Standard Performance FPS | 624.01631317224053 FPS | PASS | 96.72 | Titan |
| GPU Spectrum 720p Low Resolution Performance FPS | 1274.0598925945812 FPS | PASS | 96.76 | Titan |
| DirectCompute Global Memory Bandwidth | 1519.3 GB/s | PASS | 97.00 | Titanium Elite |
| DirectCompute FP32 Compute Throughput | 117209.5 GFLOPS | PASS | 96.88 | Titan |
| Cyberpunk Game-Style 8K FPS | 32.922583204047349 FPS | PASS | 97.35 | Titanium Elite |
| Cyberpunk Game-Style 8K Score | 3292 Score | PASS | 97.36 | Titanium Elite |
| GPU Cryptocurrency Compute Benchmark | 0.26415795809447146 est. USD/h | PASS | 96.90 | Titan |
| Test | Measurement | Status | Score | Tier |
|---|---|---|---|---|
| CPU All-Thread Compression | 3003.60 MB/s | PASS | 94.28 | Titan |
| CPU Single-Thread Math | 10.47 M ops/sec | PASS | 94.36 | Titan |
| CPU 7-Zip Single-Thread Compression | 8254 MIPS | PASS | 92.50 | Titan |
| CPU 7-Zip Single-Thread Decompression | 9180 MIPS | PASS | 93.73 | Titan |
| CPU 7-Zip Single-Thread Total Rating | 8717 MIPS | PASS | 94.37 | Titan |
| CPU 7-Zip Multi-Thread Compression | 198679 MIPS | PASS | 96.27 | Titan |
| CPU 7-Zip Multi-Thread Decompression | 194331 MIPS | PASS | 93.33 | Titan |
| CPU 7-Zip Multi-Thread Total Rating | 196505 MIPS | PASS | 94.63 | Titan |
| OpenSSL SHA-256 Throughput | 101.719 GB/s | PASS | 100.00 |  Titanium Elite Future |
| OpenSSL AES-256-CBC Throughput | 41.160 GB/s | PASS | 96.08 | Titan |
| CPU-Z Single Thread Score | 894.8 Score | PASS | 97.22 | Titanium Elite |
| CPU-Z Multi Thread Score | 17946.9 Score | PASS | 97.33 | Titanium Elite |
| System Stability Tester 1M | 1.548 Seconds | PASS | 91.19 |  Platinum |
| System Stability Tester 2M | 3.240 Seconds | PASS | 92.44 | Titan |
| System Stability Tester 4M | 7.664 Seconds | PASS | 91.41 | Platinum |
| SuperPI 32M Single-Thread Benchmark | 90.693 Seconds | PASS | 89.30 | Platinum |
| Test | Measurement | Status | Score | Tier |
|---|---|---|---|---|
| Intel MLC Bandwidth Matrix | 121.53 GB/s | PASS | 99.28 | Titanium Elite Future |
| Intel MLC Peak Injection Bandwidth | 105.04 GB/s | PASS | 98.43 | Titanium Elite Future |
| Intel MLC Idle Latency | 80.10 ns | PASS | 91.93 | Platinum |
| Test | Measurement | Status | Score | Tier |
|---|---|---|---|---|
| DiskSpd SEQ1M Q8T1 Read | 7123.26 MB/s | PASS | 97.07 | Titanium Elite |
| DiskSpd SEQ1M Q1T1 Read | 5375.37 MB/s | PASS | 97.20 | Titanium Elite |
| DiskSpd SEQ1M Q8T1 Write | 6881.88 MB/s | PASS | 97.00 | Titanium Elite |
| DiskSpd SEQ1M Q1T1 Write | 1284.56 MB/s | PASS | 87.00 | Platinum |
| DiskSpd RND4K Q32T1 Read | 1044.27 MB/s | PASS | 97.40 | Titanium Elite |
| DiskSpd RND4K Q32T1 Write | 940.97 MB/s | PASS | 97.30 | Titanium Elite |
| DiskSpd RND4K Q1T1 Read | 294.61 MB/s | PASS | 98.10 | Titanium Elite |
| DiskSpd RND4K Q1T1 Write | 351.84 MB/s | PASS | 97.60 | Titanium Elite |
| Test | Measurement | Status | Score | Tier |
|---|---|---|---|---|
| CPU Single-Core | 18518.716078483332 inferences/s | PASS | 96.89 | Titan |
| CPU Multi-Thread | 351166.80608299031 inferences/s | PASS | 97.33 | Titanium Elite |
| GPU Compute | 4747418.4316843692 inferences/s | PASS | 96.91 | Titan |
| Image Generation | 13.0593133 seconds/image | PASS | 98.64 | Titanium Elite Future |
| Video Generation | 18.8130226 seconds/clip | PASS | 98.60 | Titanium Elite Future |
| LLM Inference | 90349.2534370904 tokens/s | PASS | 97.01 | Titanium Elite |
| Computer Vision | 10838.271197985085 images/s | PASS | 96.62 | Titan |
| Speech Recognition | 1448.63334233735 audio seconds/s | PASS | 96.92 | Titan |
| Image Upscaling | 105.12456712006752 output MP/s | PASS | 97.66 | Titanium Elite |
| Semantic Search | 2198.2951593108555 documents/s | PASS | 97.19 | Titanium Elite |
| Test | Measurement | Status | Score | Tier |
|---|---|---|---|---|
| Navigation | 90.105365829184677 routes/s | PASS | 96.62 | Titan |
| HTML5 Browser | 63.140126953681957 browser transactions/s | PASS | 95.71 | Titan |
| PDF Viewer | 224.05481778689548 pages/s | PASS | 95.61 | Titan |
| Photo Library Import | 88.8521778016788 photos/s | PASS | 95.31 | Titan |
| Software Compilation | 83.287746512395117 translation units/s | PASS | 97.28 | Titanium Elite |
| Text Processing | 1916.2432282275015 documents/s | PASS | 97.08 | Titanium Elite |
| HDR Image Processing | 8.45879978599886 output MP/s | PASS | 92.11 | Titan |
| Photo Editing & Export | 28.4627279169616 edited photos/s | PASS | 96.16 | Titan |
| 3D Reconstruction from Photos | 1.5808380715551296 eight-view batches/s | PASS | 96.43 | Titan |
| Video Encoding - CPU VP9 | 37.705915813102635 encoded frames/s | PASS | 94.67 | Titan |
| Audio Encoding - CPU AAC | 78.458396650592562 audio seconds/s | PASS | 95.52 | Titan |
| Video / Audio Decoding - CPU | 612.51504415742852 decoded video frames/s | PASS | 95.19 | Titan |
| Four-Person Video Call Processing | 2.283052887004505 meeting seconds/s | PASS | 95.34 | Titan |
| Heavy 4K Live Video | 100 experience points / 100 | PASS | 97.10 | Titanium Elite |
| 4K / 60 FPS Local CPU Processing | 93.35286227671358 4K frames/s | PASS | 95.80 | Titan |
| Simulated Video Game Startup | 13.868252299999996 seconds | PASS | 96.12 | Titan |
| Simulated Windows 11 Startup | 6.14025463333337 seconds | PASS | 97.29 | Titanium Elite |
9d9f406e6a7842d8a98f3ddd88d351354f387bb6e351b18fea1ad075b045fa84