

Graphics
9 tests · 32.94%See how your GPU performs across rendering, graphics memory and visual compute tasks.
A comprehensive evaluation across modern computing workloads.
See how your GPU performs across rendering, graphics memory and visual compute tasks.
Measure single-core and multi-core performance across computing workloads and algorithms.
Understand memory bandwidth, latency and real-world memory performance.
See how your system handles sequential throughput and random storage access.
Measure dedicated AI acceleration across generation, inference, vision, speech and more.
See end-to-end performance in practical scenarios and common productivity workloads.
A calibrated tier rating /100 — not a raw speed percentage or percentile.
Select a tier to view its official artwork.
| Tier | Starting score |
|---|---|
| Standard | 50 |
| Bronze | 56.9 |
| Silver | 65 |
| Gold | 75 |
| Platinum | 85 |
| Titan | 92 |
| Titanium Elite | 97 |
| Titanium Elite Future | Above 98.1 |
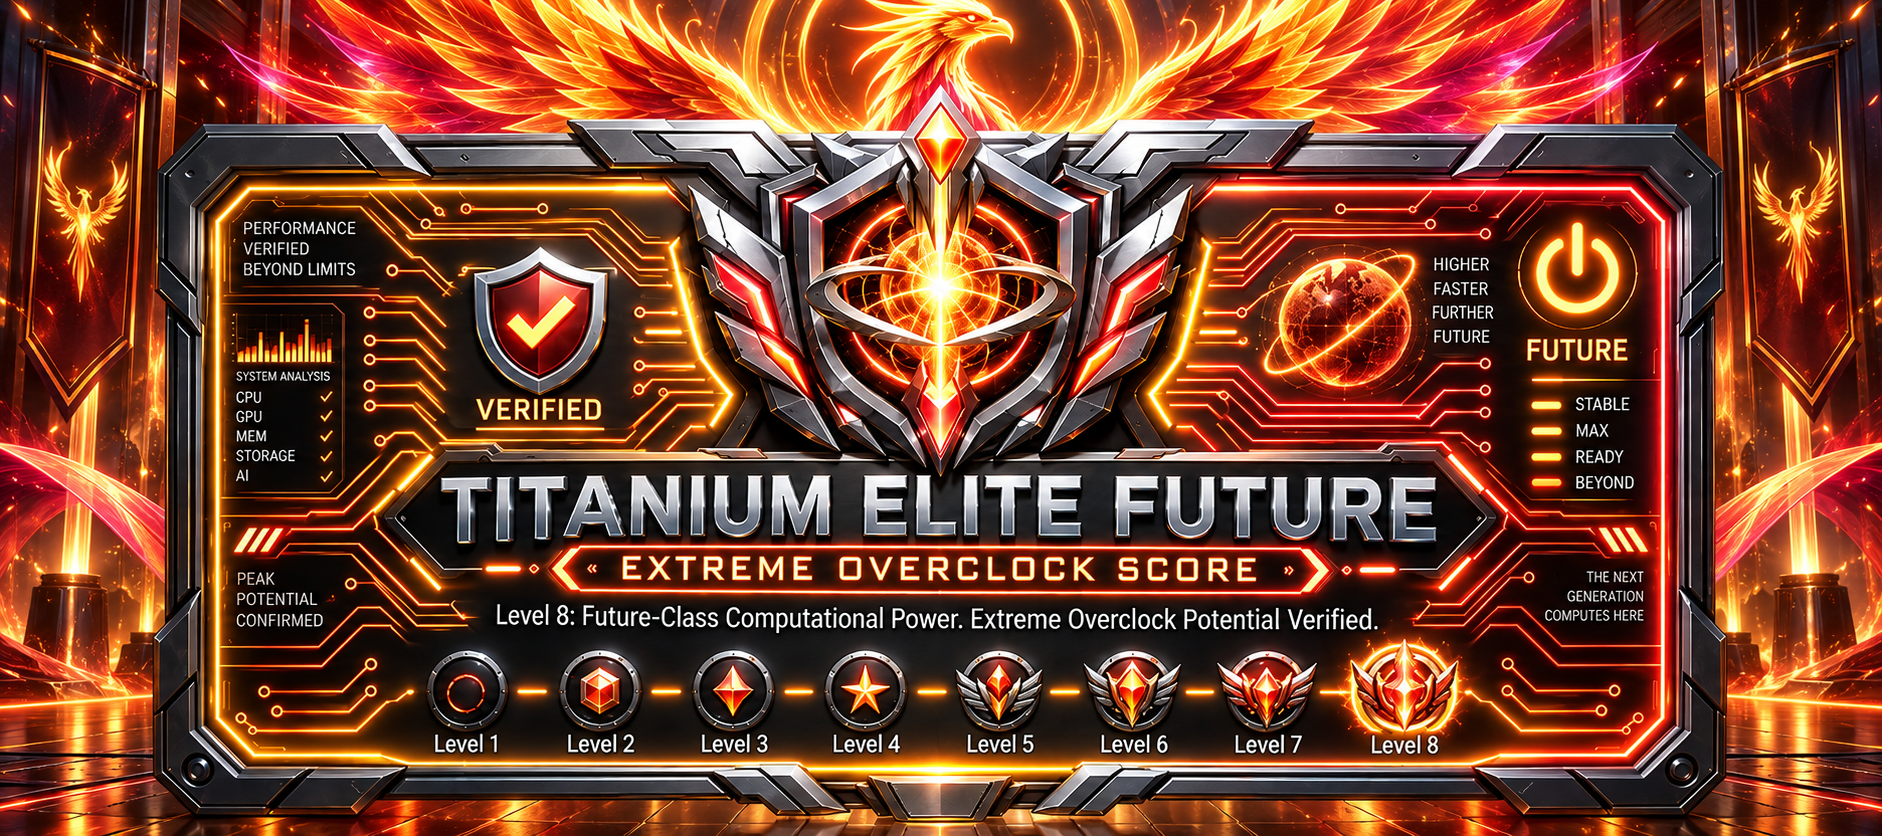 Titanium Elite Future
Failed or skipped tests remain visible and receive Standard 50.
Projected completion is labeled Estimated and is not a completed measurement.
The best overall run appears in comparisons. Every accepted run remains in history.
The Standard suite contains 36 hardware results, 10 AI Compute tests and 17 Real World tests. The category counts and weights above describe this suite; a receipt displays the detailed rows actually read from its report.
Weights are rounded for readability: Graphics 28/85, CPU 20/85, Memory 8/85, Storage 12/85, AI Compute 0.1 and Real World 0.1.
The released benchmark floor is 50. Standard covers scores below 56.9; each following tier starts at the boundary in the table. Titanium Elite includes 98.10. Titanium Elite Future begins strictly above 98.1 and uses the original orange/red Extreme Overclock Score artwork.
Individual failed or skipped tests receive the Standard 50 fallback. Their measurements are not presented as completed. Even a completed full run with every test at 50 remains eligible for ranking.
Some slow-system generation checkpoints project completion time from partial work. These results remain scored and clearly labeled Estimated; they are not completed measurement baselines.
Each comparison group uses the computer's best overall run. Equal overall scores are ordered by points, then submission time. Every accepted run retains its own hardware snapshot in history.
The receipt confirms that the receiver accepted and stored a result. It does not independently certify hardware, identify its owner or attest that a measurement is correct. Decorative wording on official tier artwork does not override the reported test status.