
Graphics
67.70/ 100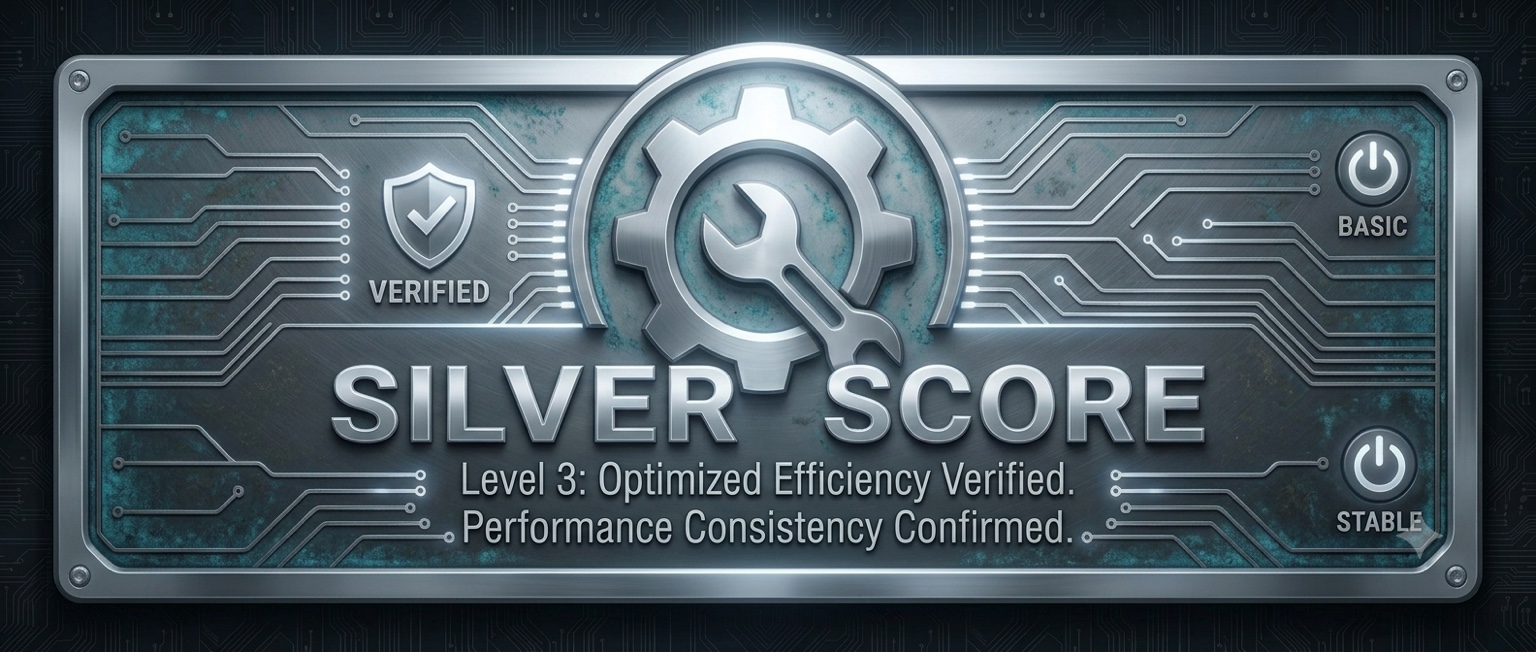 Silver
Sep 30, 2026 · 19:39 UTC · Benchmark Standard · Completed benchmark
AI Now Bench 7 tier score
Tier artwork reflects the reported score. Received & stored confirms receipt of the run; it is not independent hardware certification.
Silver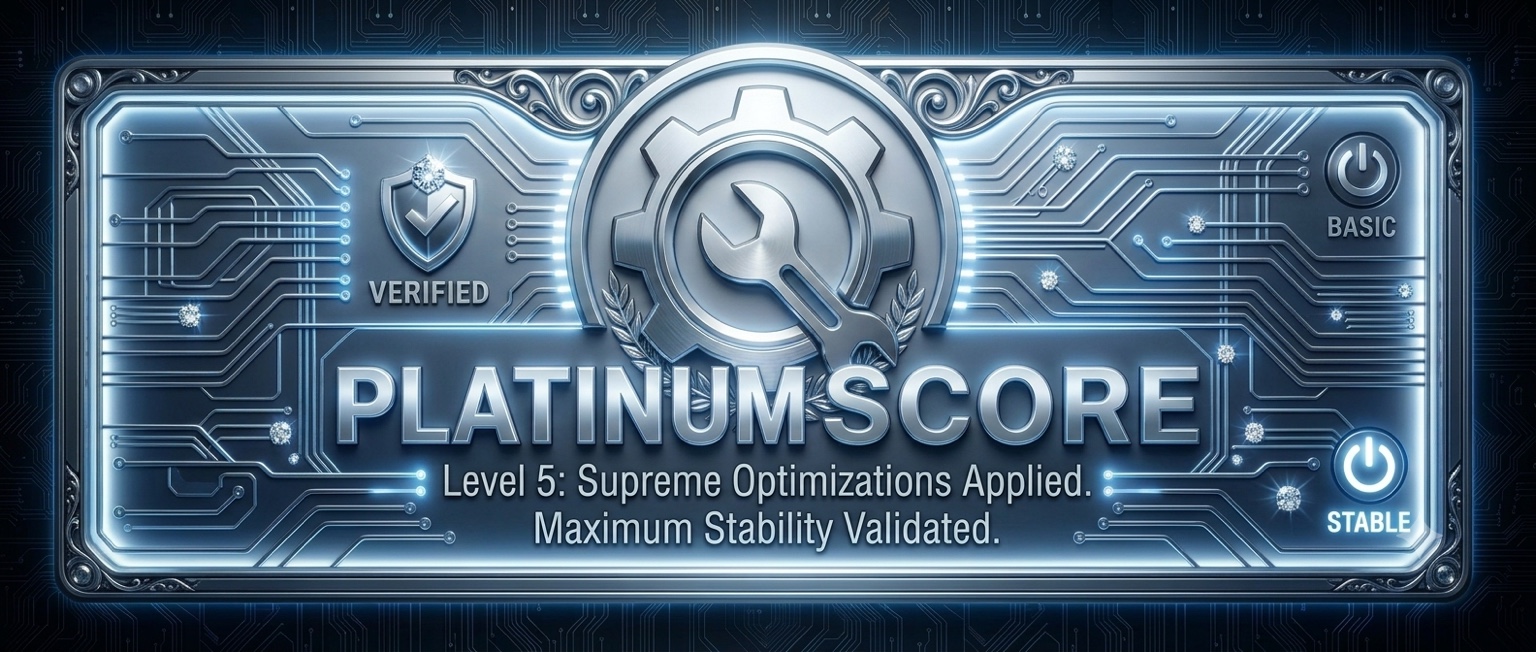 PlatinumPlatinum
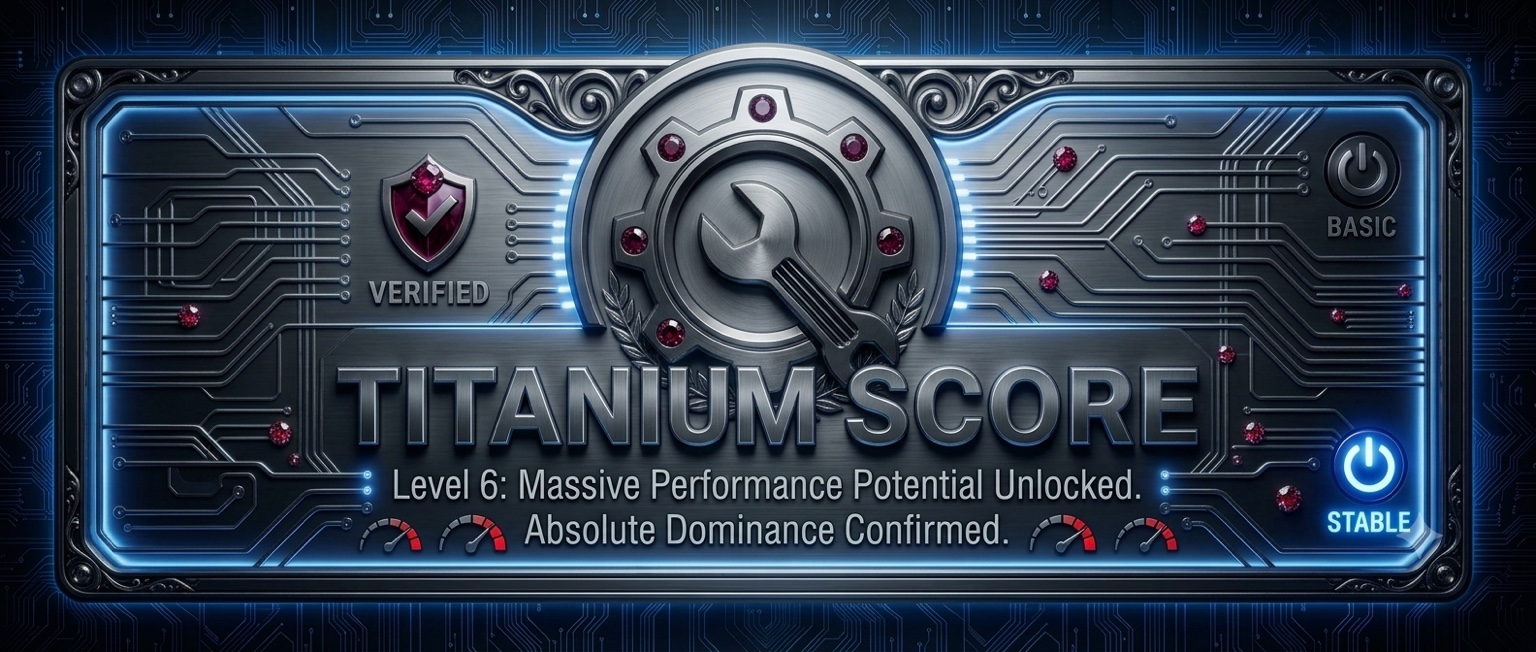 Titan
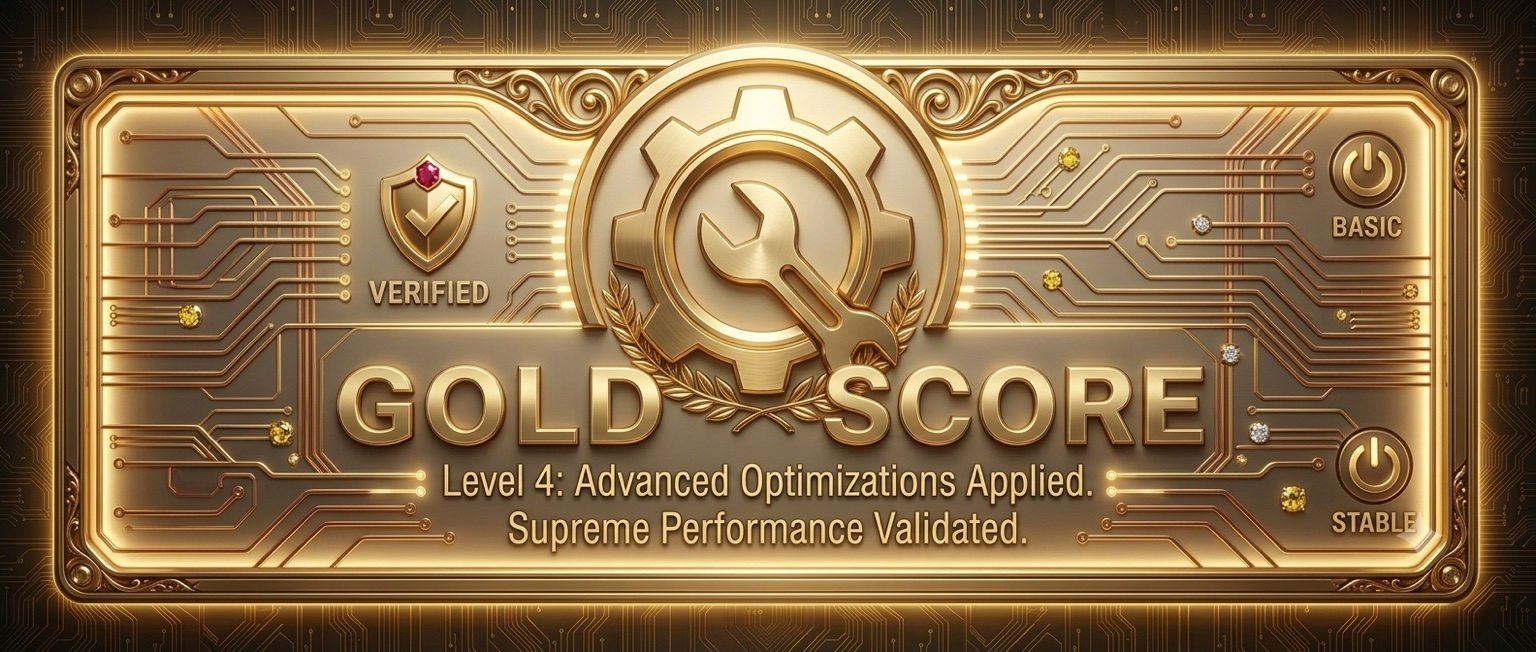 GoldPlatinum
| Test | Measurement | Status | Score | Tier |
|---|---|---|---|---|
| GPU Spectrum 8K Maximum Performance FPS | 3.2811256854184561 FPS | PASS | 70.54 | Silver |
| GPU Spectrum 4K Balanced Performance FPS | 12.868551447915042 FPS | PASS | 70.39 | Silver |
| GPU Spectrum 1080p Standard Performance FPS | 49.154813945732251 FPS | PASS | 70.40 | Silver |
| GPU Spectrum 720p Low Resolution Performance FPS | 104.96818414338614 FPS | PASS | 71.01 | Silver |
| DirectCompute Global Memory Bandwidth | 82.7 GB/s | PASS | 66.95 | Silver |
| DirectCompute FP32 Compute Throughput | 4146.5 GFLOPS | PASS | 63.15 | 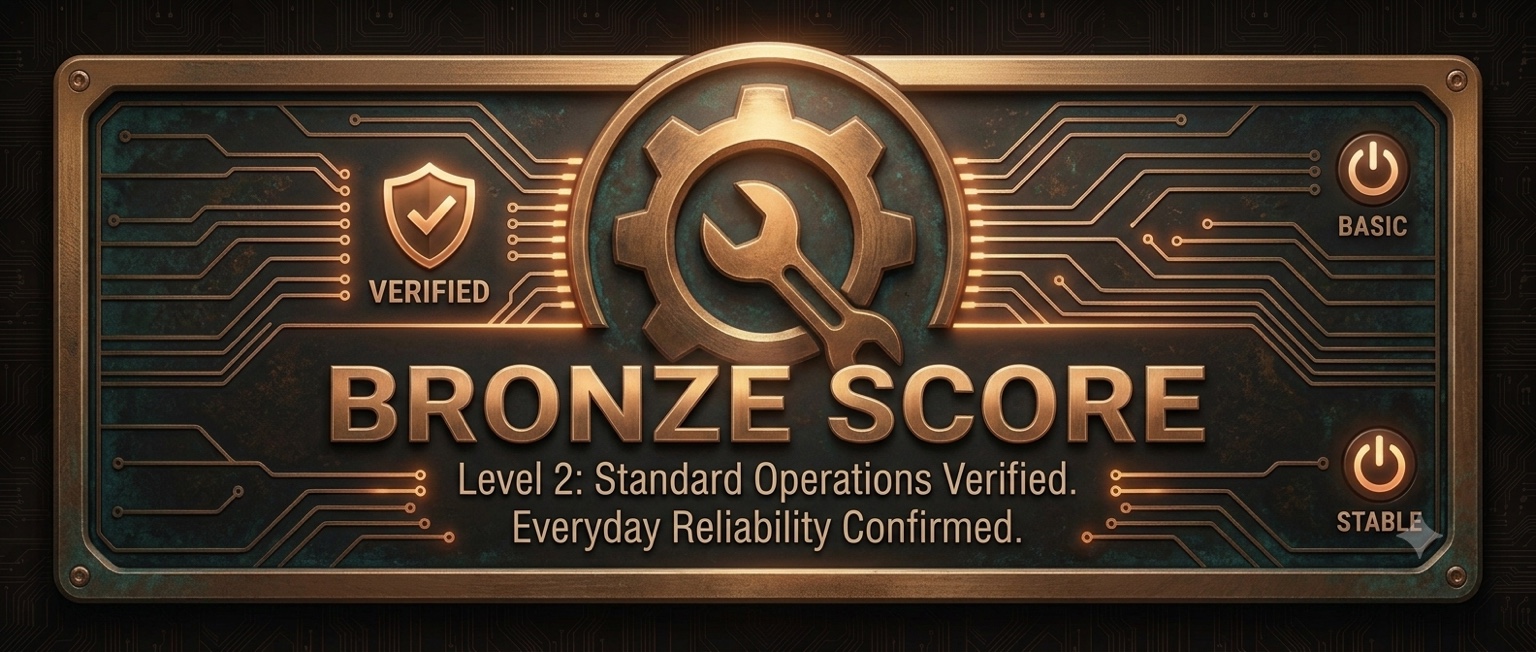 Bronze |
| Cyberpunk Game-Style 8K FPS | 1.7235490187682232 FPS | PASS | 67.34 | Silver |
| Cyberpunk Game-Style 8K Score | 172 Score | PASS | 67.33 | Silver |
| GPU Cryptocurrency Compute Benchmark | 0.01131256763409587 est. USD/h | PASS | 62.78 | Bronze |
| Test | Measurement | Status | Score | Tier |
|---|---|---|---|---|
| CPU All-Thread Compression | 1334.32 MB/s | PASS | 77.50 | Gold |
| CPU Single-Thread Math | 7.95 M ops/sec | PASS | 91.12 | Platinum |
| CPU 7-Zip Single-Thread Compression | 3931 MIPS | PASS | 75.15 | Gold |
| CPU 7-Zip Single-Thread Decompression | 8622 MIPS | PASS | 93.10 | Titan |
| CPU 7-Zip Single-Thread Total Rating | 6277 MIPS | PASS | 89.74 | Platinum |
| CPU 7-Zip Multi-Thread Compression | 73033 MIPS | PASS | 77.03 | Gold |
| CPU 7-Zip Multi-Thread Decompression | 77173 MIPS | PASS | 73.35 | Silver |
| CPU 7-Zip Multi-Thread Total Rating | 75103 MIPS | PASS | 74.97 | Silver |
| OpenSSL SHA-256 Throughput | 42.877 GB/s | PASS | 93.28 | Titan |
| OpenSSL AES-256-CBC Throughput | 17.377 GB/s | PASS | 79.92 | Gold |
| CPU-Z Single Thread Score | 758.2 Score | PASS | 95.66 | Titan |
| CPU-Z Multi Thread Score | 7287.6 Score | PASS | 83.55 | Gold |
| System Stability Tester 1M | 1.291 Seconds | PASS | 93.41 | Titan |
| System Stability Tester 2M | 2.988 Seconds | PASS | 93.20 | Titan |
| System Stability Tester 4M | 6.897 Seconds | PASS | 92.75 | Titan |
| SuperPI 32M Single-Thread Benchmark | 77.461 Seconds | PASS | 92.50 | Titan |
| Test | Measurement | Status | Score | Tier |
|---|---|---|---|---|
| Intel MLC Bandwidth Matrix | 90.57 GB/s | PASS | 97.31 | 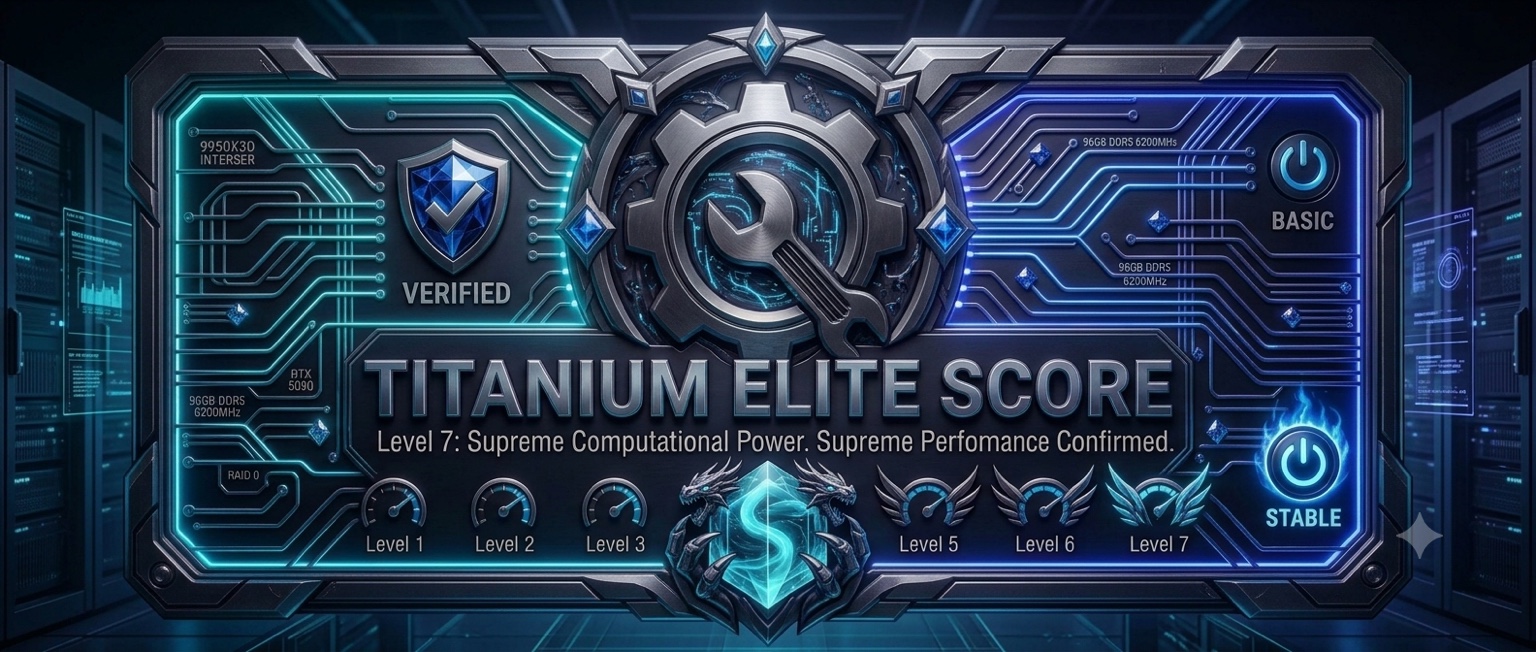 Titanium Elite |
| Intel MLC Peak Injection Bandwidth | 74.13 GB/s | PASS | 97.31 | Titanium Elite |
| Intel MLC Idle Latency | 207.20 ns | PASS | 50.00 | 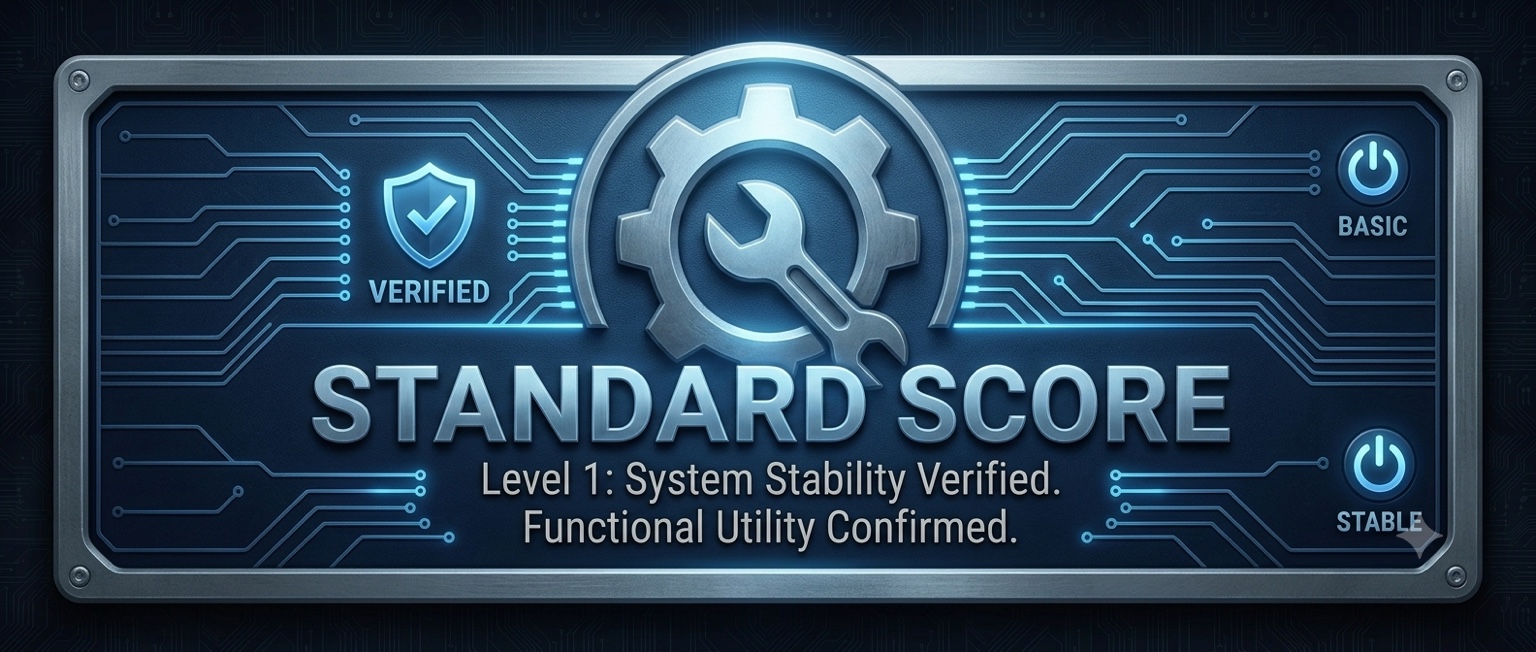 Standard |
| Test | Measurement | Status | Score | Tier |
|---|---|---|---|---|
| DiskSpd SEQ1M Q8T1 Read | 6888.84 MB/s | PASS | 97.03 | Titanium Elite |
| DiskSpd SEQ1M Q1T1 Read | 3485.64 MB/s | PASS | 95.70 | Titan |
| DiskSpd SEQ1M Q8T1 Write | 5436.93 MB/s | PASS | 95.80 | Titan |
| DiskSpd SEQ1M Q1T1 Write | 3999.04 MB/s | PASS | 95.10 | Titan |
| DiskSpd RND4K Q32T1 Read | 1086.87 MB/s | PASS | 97.40 | Titanium Elite |
| DiskSpd RND4K Q32T1 Write | 951.62 MB/s | PASS | 97.40 | Titanium Elite |
| DiskSpd RND4K Q1T1 Read | 144.66 MB/s | PASS | 97.40 | Titanium Elite |
| DiskSpd RND4K Q1T1 Write | 141.29 MB/s | PASS | 86.60 | Platinum |
| Test | Measurement | Status | Score | Tier |
|---|---|---|---|---|
| CPU Single-Core | 15172.156306750889 inferences/s | PASS | 94.46 | Titan |
| CPU Multi-Thread | 131225.40601293763 inferences/s | PASS | 88.77 | Platinum |
| GPU Compute | 618878.93655119464 inferences/s | PASS | 78.65 | Gold |
| Image Generation | 93.9424382 seconds/image | PASS | 81.19 | Gold |
| Video Generation | 97.5588896 seconds/clip | PASS | 84.47 | Gold |
| LLM Inference | 11299.185867439648 tokens/s | PASS | 78.48 | Gold |
| Computer Vision | 939.22391154033471 images/s | PASS | 76.50 | Gold |
| Speech Recognition | 151.00242053009276 audio seconds/s | PASS | 77.42 | Gold |
| Image Upscaling | 2.3177807290684536 output MP/s | PASS | 68.48 | Silver |
| Semantic Search | 876.48042323221443 documents/s | PASS | 88.54 | Platinum |
| Test | Measurement | Status | Score | Tier |
|---|---|---|---|---|
| Navigation | 74.07516457576223 routes/s | PASS | 94.27 | Titan |
| HTML5 Browser | 47.321818042132527 browser transactions/s | PASS | 92.63 | Titan |
| PDF Viewer | 129.34123152502914 pages/s | PASS | 82.12 | Gold |
| Photo Library Import | 51.345189229409527 photos/s | PASS | 81.69 | Gold |
| Software Compilation | 14.08958769098132 translation units/s | PASS | 66.58 | Silver |
| Text Processing | 1451.2299829758697 documents/s | PASS | 94.16 | Titan |
| HDR Image Processing | 5.1825631173276765 output MP/s | PASS | 77.68 | Gold |
| Photo Editing & Export | 19.231361599491912 edited photos/s | PASS | 92.03 | Titan |
| 3D Reconstruction from Photos | 1.1101254176924904 eight-view batches/s | PASS | 92.56 | Titan |
| Video Encoding - CPU VP9 | 22.998776771726295 encoded frames/s | PASS | 81.67 | Gold |
| Audio Encoding - CPU AAC | 50.445277215500866 audio seconds/s | PASS | 84.04 | Gold |
| Video / Audio Decoding - CPU | 446.48953112855258 decoded video frames/s | PASS | 91.99 | Platinum |
| Four-Person Video Call Processing | 1.5802682335447105 meeting seconds/s | PASS | 86.63 | Platinum |
| Heavy 4K Live Video | 66.320664620913831 experience points / 100 | PASS | 89.42 | Platinum |
| 4K / 60 FPS Local CPU Processing | 61.656620325173847 4K frames/s | PASS | 85.42 | Platinum |
| Simulated Video Game Startup | 36.439422500000241 seconds | PASS | 77.54 | Gold |
| Simulated Windows 11 Startup | 18.661056566665746 seconds | PASS | 77.56 | Gold |
4d9c13ec371745fd8573720b1aacf614e4d9ad285118fde458a112a9a3ae0224