
Graphics
81.00/ 100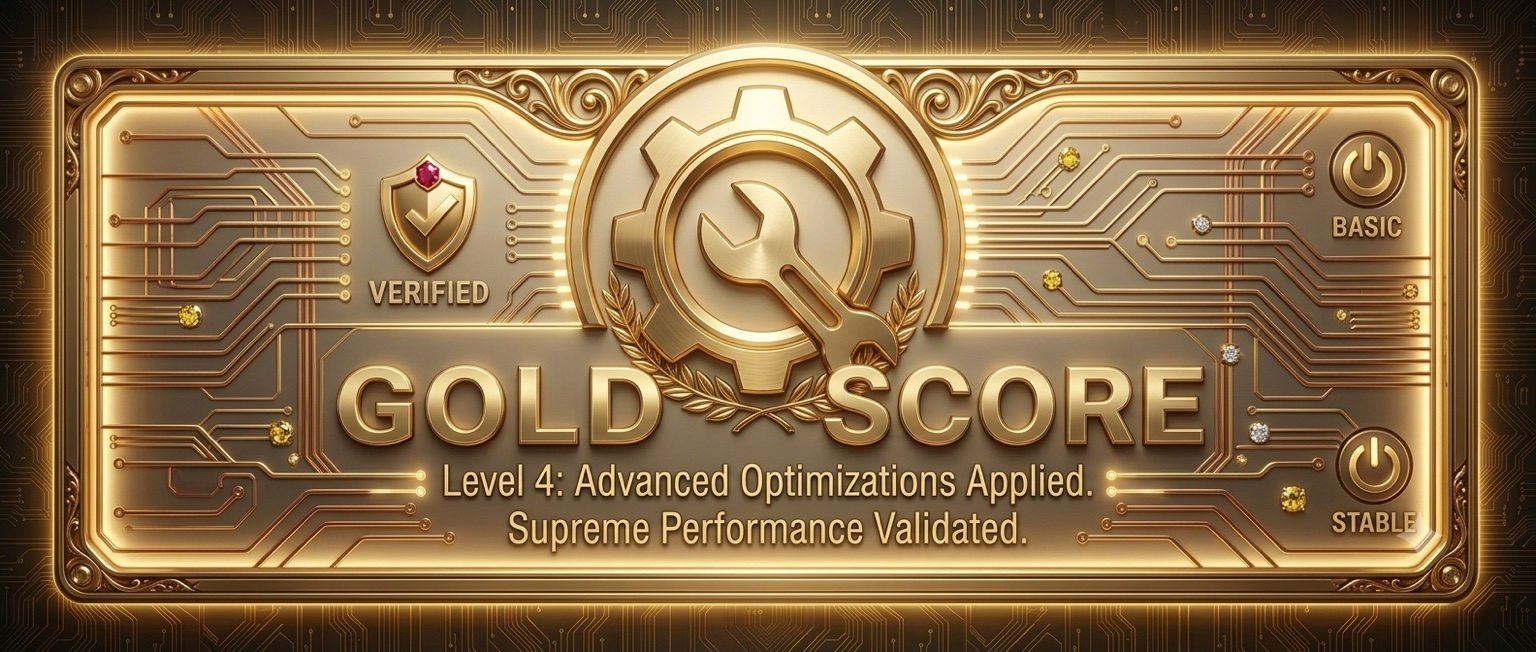 Gold
Oct 21, 2026 · 15:47 UTC · Benchmark Standard · Completed benchmark
AI Now Bench 7 tier score
Tier artwork reflects the reported score. Received & stored confirms receipt of the run; it is not independent hardware certification.
Gold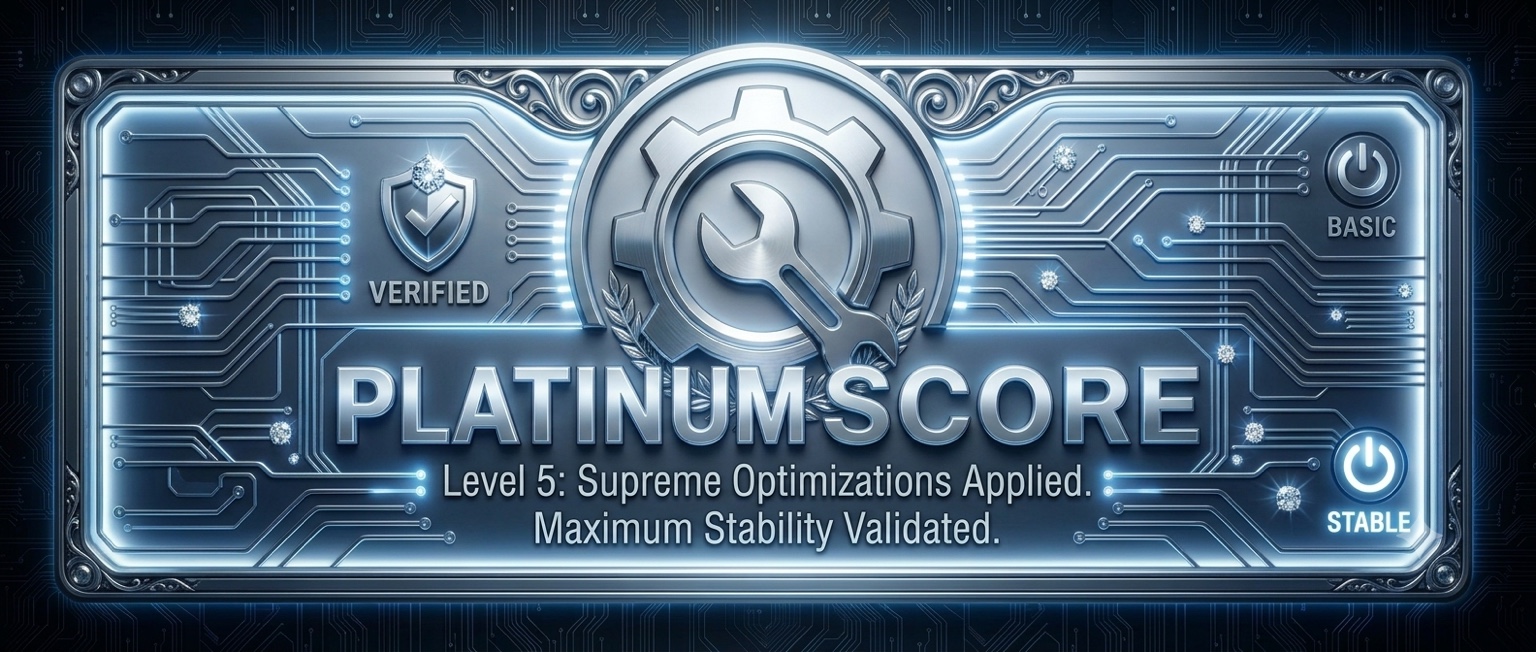 Platinum
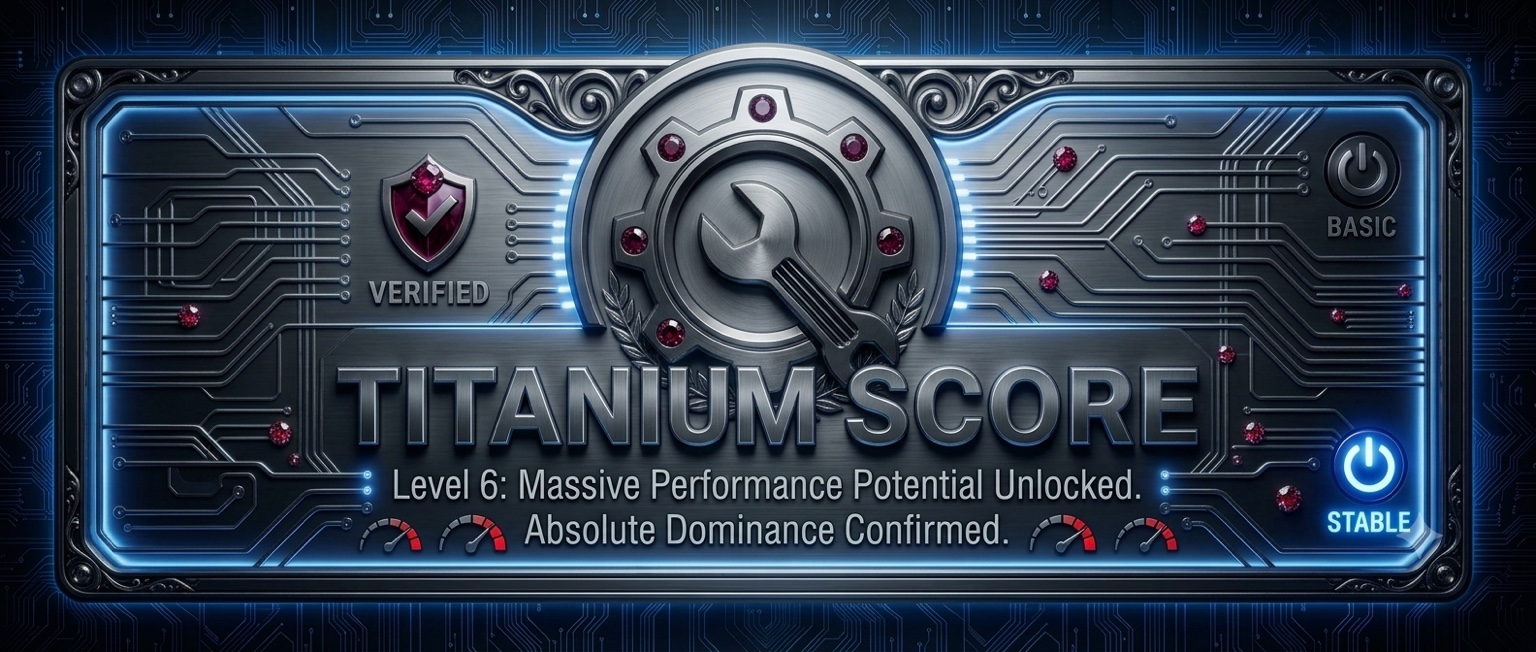 TitanPlatinumPlatinumTitan
| Test | Measurement | Status | Score | Tier |
|---|---|---|---|---|
| GPU Spectrum 8K Maximum Performance FPS | 8.32194110782215 FPS | PASS | 80.72 | Gold |
| GPU Spectrum 4K Balanced Performance FPS | 32.830402829042711 FPS | PASS | 80.64 | Gold |
| GPU Spectrum 1080p Standard Performance FPS | 122.69289240074322 FPS | PASS | 80.38 | Gold |
| GPU Spectrum 720p Low Resolution Performance FPS | 235.87986057750393 FPS | PASS | 79.73 | Gold |
| DirectCompute Global Memory Bandwidth | 333.3 GB/s | PASS | 82.22 | Gold |
| DirectCompute FP32 Compute Throughput | 22349.2 GFLOPS | PASS | 80.24 | Gold |
| Cyberpunk Game-Style 8K FPS | 6.3162122859211136 FPS | PASS | 81.53 | Gold |
| Cyberpunk Game-Style 8K Score | 632 Score | PASS | 81.55 | Gold |
| GPU Cryptocurrency Compute Benchmark | 0.056610081777792767 est. USD/h | PASS | 80.29 | Gold |
| Test | Measurement | Status | Score | Tier |
|---|---|---|---|---|
| CPU All-Thread Compression | 1513.18 MB/s | PASS | 80.52 | Gold |
| CPU Single-Thread Math | 14.64 M ops/sec | PASS | 97.59 | 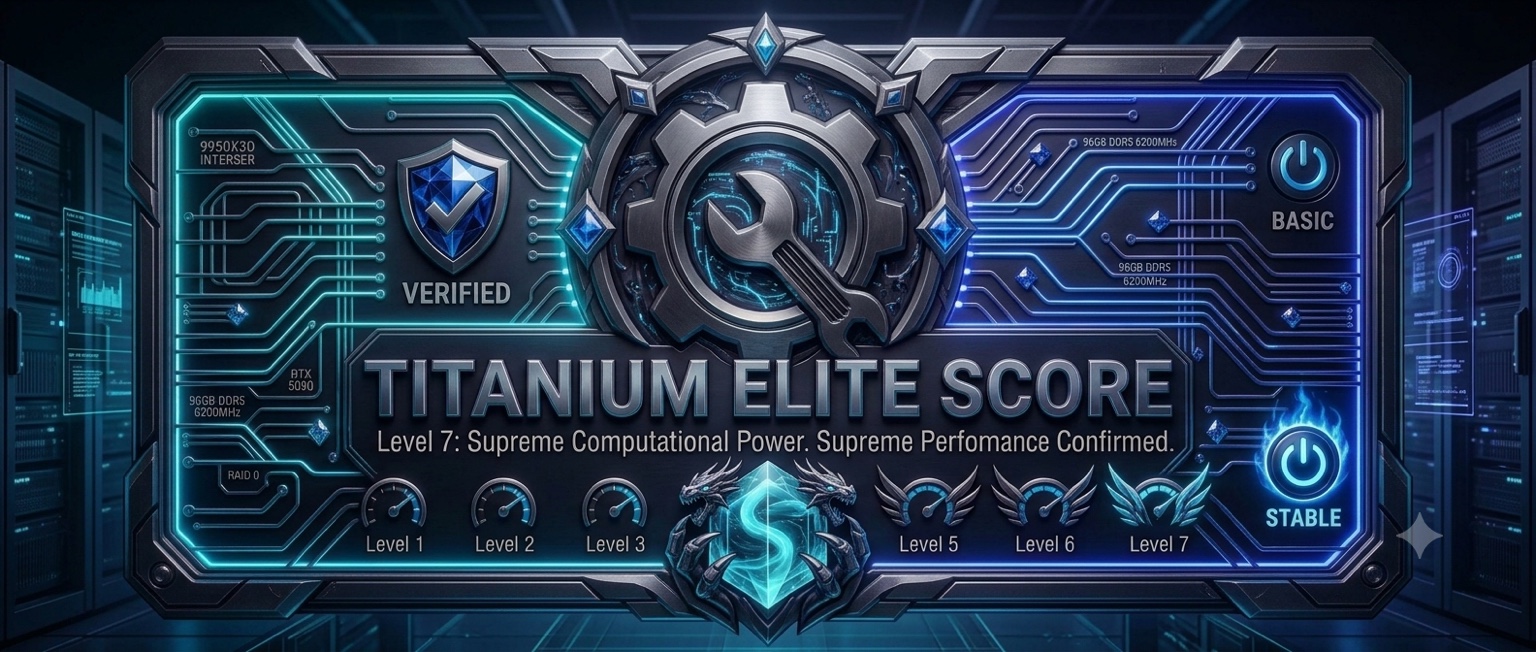 Titanium Elite |
| CPU 7-Zip Single-Thread Compression | 7730 MIPS | PASS | 91.74 | Platinum |
| CPU 7-Zip Single-Thread Decompression | 10087 MIPS | PASS | 94.75 | Titan |
| CPU 7-Zip Single-Thread Total Rating | 8909 MIPS | PASS | 94.61 | Titan |
| CPU 7-Zip Multi-Thread Compression | 112505 MIPS | PASS | 87.76 | Platinum |
| CPU 7-Zip Multi-Thread Decompression | 97164 MIPS | PASS | 78.11 | Gold |
| CPU 7-Zip Multi-Thread Total Rating | 104835 MIPS | PASS | 82.88 | Gold |
| OpenSSL SHA-256 Throughput | 50.246 GB/s | PASS | 94.97 | Titan |
| OpenSSL AES-256-CBC Throughput | 19.923 GB/s | PASS | 83.57 | Gold |
| CPU-Z Single Thread Score | 728.9 Score | PASS | 95.19 | Titan |
| CPU-Z Multi Thread Score | 8438.2 Score | PASS | 87.14 | Platinum |
| System Stability Tester 1M | 1.140 Seconds | PASS | 94.73 | Titan |
| System Stability Tester 2M | 2.503 Seconds | PASS | 95.09 | Titan |
| System Stability Tester 4M | 5.575 Seconds | PASS | 94.96 | Titan |
| SuperPI 32M Single-Thread Benchmark | 64.718 Seconds | PASS | 94.28 | Titan |
| Test | Measurement | Status | Score | Tier |
|---|---|---|---|---|
| Intel MLC Bandwidth Matrix | 120.56 GB/s | PASS | 99.22 |  Titanium Elite Future |
| Intel MLC Peak Injection Bandwidth | 118.68 GB/s | PASS | 98.82 | Titanium Elite Future |
| Intel MLC Idle Latency | 92.90 ns | PASS | 81.39 | Gold |
| Test | Measurement | Status | Score | Tier |
|---|---|---|---|---|
| DiskSpd SEQ1M Q8T1 Read | 7046.11 MB/s | PASS | 97.05 | Titanium Elite |
| DiskSpd SEQ1M Q1T1 Read | 2354.10 MB/s | PASS | 92.90 | Titan |
| DiskSpd SEQ1M Q8T1 Write | 1050.21 MB/s | PASS | 85.40 | Platinum |
| DiskSpd SEQ1M Q1T1 Write | 1272.75 MB/s | PASS | 86.90 | Platinum |
| DiskSpd RND4K Q32T1 Read | 469.82 MB/s | PASS | 97.10 | Titanium Elite |
| DiskSpd RND4K Q32T1 Write | 292.55 MB/s | PASS | 91.50 | Platinum |
| DiskSpd RND4K Q1T1 Read | 122.03 MB/s | PASS | 97.20 | Titanium Elite |
| DiskSpd RND4K Q1T1 Write | 124.76 MB/s | PASS | 83.90 | Gold |
| Test | Measurement | Status | Score | Tier |
|---|---|---|---|---|
| CPU Single-Core | 16876.407917142333 inferences/s | PASS | 95.70 | Titan |
| CPU Multi-Thread | 183814.55816141679 inferences/s | PASS | 92.21 | Titan |
| GPU Compute | 1447833.739815305 inferences/s | PASS | 85.76 | Platinum |
| Image Generation | 53.6565558 seconds/image | PASS | 86.08 | Platinum |
| Video Generation | 78.54182 seconds/clip | PASS | 85.95 | Platinum |
| LLM Inference | 31220.606633168536 tokens/s | PASS | 86.61 | Platinum |
| Computer Vision | 3046.0187298355863 images/s | PASS | 85.19 | Platinum |
| Speech Recognition | 523.79220949729358 audio seconds/s | PASS | 86.83 | Platinum |
| Image Upscaling | 27.480832350345533 output MP/s | PASS | 85.67 | Platinum |
| Semantic Search | 1348.646339694013 documents/s | PASS | 92.81 | Titan |
| Test | Measurement | Status | Score | Tier |
|---|---|---|---|---|
| Navigation | 86.985771731467963 routes/s | PASS | 96.16 | Titan |
| HTML5 Browser | 57.573639908987424 browser transactions/s | PASS | 94.63 | Titan |
| PDF Viewer | 191.6572698451393 pages/s | PASS | 93.85 | Titan |
| Photo Library Import | 70.920436352149636 photos/s | PASS | 92.91 | Titan |
| Software Compilation | 59.931542596180073 translation units/s | PASS | 93.98 | Titan |
| Text Processing | 1758.6786802930626 documents/s | PASS | 96.43 | Titan |
| HDR Image Processing | 7.2052908851260842 output MP/s | PASS | 83.06 | Gold |
| Photo Editing & Export | 22.488738764073112 edited photos/s | PASS | 93.49 | Titan |
| 3D Reconstruction from Photos | 1.2258912499401466 eight-view batches/s | PASS | 93.51 | Titan |
| Video Encoding - CPU VP9 | 27.792894430554171 encoded frames/s | PASS | 87.37 | Platinum |
| Audio Encoding - CPU AAC | 69.159194898847247 audio seconds/s | PASS | 94.08 | Titan |
| Video / Audio Decoding - CPU | 497.54691719253668 decoded video frames/s | PASS | 92.98 | Titan |
| Four-Person Video Call Processing | 1.7924214271149872 meeting seconds/s | PASS | 92.78 | Titan |
| Heavy 4K Live Video | 95.163549448902486 experience points / 100 | PASS | 97.08 | Titanium Elite |
| 4K / 60 FPS Local CPU Processing | 70.842223185091328 4K frames/s | PASS | 92.81 | Titan |
| Simulated Video Game Startup | 33.585042966684945 seconds | PASS | 79.46 | Gold |
| Simulated Windows 11 Startup | 18.663028566671223 seconds | PASS | 77.56 | Gold |
31a399b83d8c49fb93d3eb1cdfc4c9aafb7b9085f2c49f93f0cc19253bb46e26